Data Visualization for Your Web-Bound Data-Story
- Timeframe: 09/25 – 10/20
- Points: 250
Description
After collecting your data, you will analyze your data, developing categories and codes for you to visualize. You will analyze and explore your data in tandem with learning some basic visualization conventions. From there, you will make decisions about how you want to visualize your categories and their relationships.
We will all be using Scalable Vector Graphics (SVG) to create our visualizations destined for your respective data-story websites. These markup, graphical objects have long since been around, but have made recent strides in functionality over the past decade in lieu of HTML5 documents. Consequently, SVG visuals have become integral digital media for web documents across design and content domains.
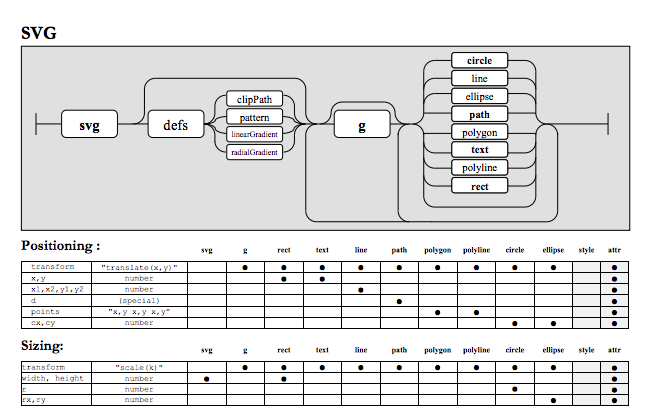
As a basic introduction, we will use the Inkscape application to create our draft visualization as a SVG file. However, since it is quite a complex practice to create visuals with SVGs, we will hand draw our data visualizations. We will subsequently use Inkscape to translate them into SVGs, as we will also learn about the basic SVG document structure (see image below).
General process
- Learn about the basic data visualization conventions.
- Explore and analyze your data.
- Learn and choose what conventions help you tell your data-story meaningfully.
- Sketch your data visualization.
- Learn basic Inkscape skills.
- Scan your final drawing as a digital image onto your computer.
- Import the image into Inkscape.
- Use Inkscape to render your image as an SVG.
- Translate your image, as needed, using the available tools in Inkscape.
- Clean your SVG for the web, making it semantically rich.
- Export the SVG to submit.
Rubric
- Data-Set and Data-Viz reflect each other: Overall design expresses the categorical relationships that you set out to emphasize
- Appropriate application of visualization conventions: Incorporates meaningful use of space and shapes to define and express your data story
- Ethically represents your findings: Data represents your findings without masking its flaws or creating an unbalanced relationship between datum.
- Legend articulates relationships clearly
- Semantically-rich SVG markup