Data Collection for Your Data-Story
- Timeframe: 08/28 – 09/10
- Points: 100
Description
We are living in a society that uses digital technology and media to collect, organize, and analyze data about a multitude of ourselves. In this class about writing and digital media, we will respond to this datafication with a project that challenges you to learn how to produce digital media and examine how data are integral texts within our everyday communication activities. Accordingly, you will collect the data necessary to complete all of the subsequent media projects in this course. To guide this process, we will all share the following broader research questions: How do we participate with algorithmic audiences? and How is this participation a form of writing? From there, each of you must choose and refine a particular topic as a mode to explore one of your own prominent, networked practices. Your aims should be to craft a project that helps you fulfill the conceptual objectives of the course (Review these objectives on the Overview page.)
The main point of this data collection is not statistical insight nor applying quasi-experimental design strategies, but to explore, examine, and gain insight into your writing practices and how digital media and data permeate it. In doing so, we will try to understand how digital media performs and communicates much more than what we may have originally thought.
To help us acclimate to the goals of this sub-project and the course, I will review this slideshow during class. I hope that it will provide you with more information and stir up more questions about the following 2 topics:
- What constitutes a good start to your Data Collection project.
- How your Data Collection project fits into the scheme of the other projects.
- How your Data Collection project provides you with the means to develop a good content strategy for your data-story: A single-page website.
General process
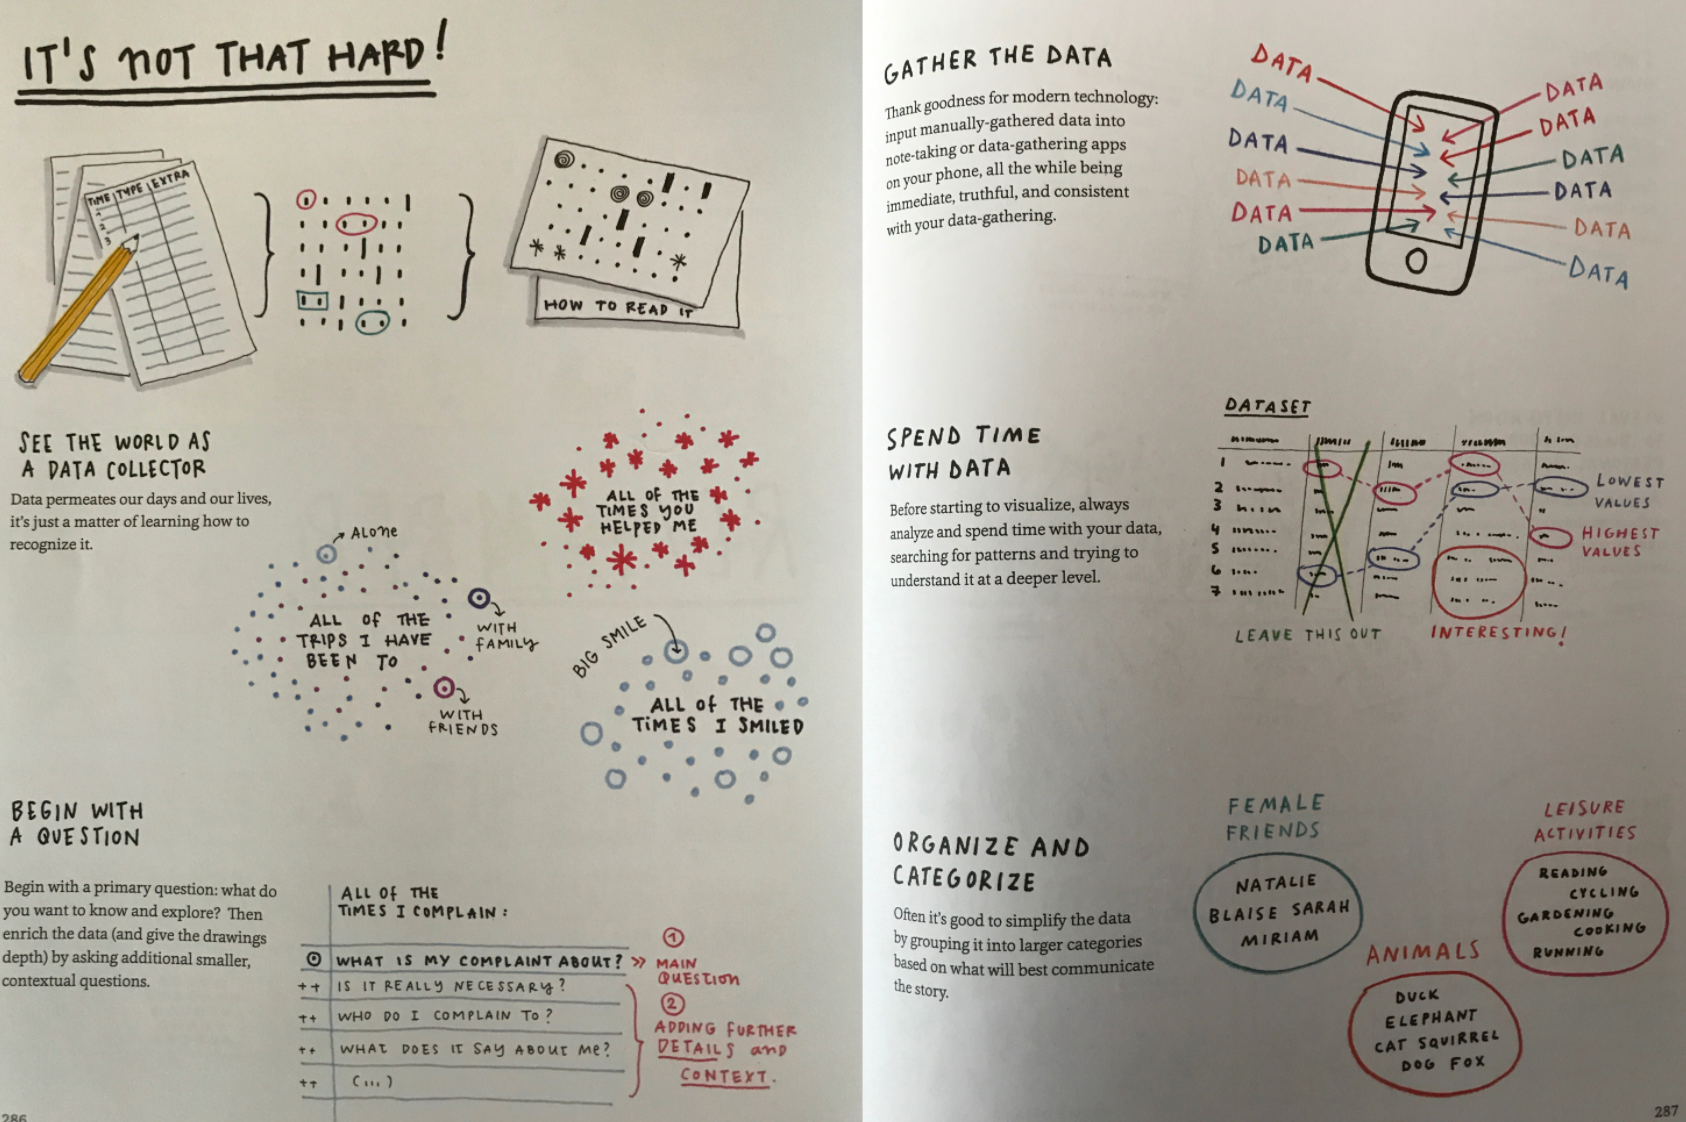
Like any good project, this one begins with a simple, personal felt dissonance—a provocation that cannot be ignored. From there, you will do the following to complete your data collection:
-
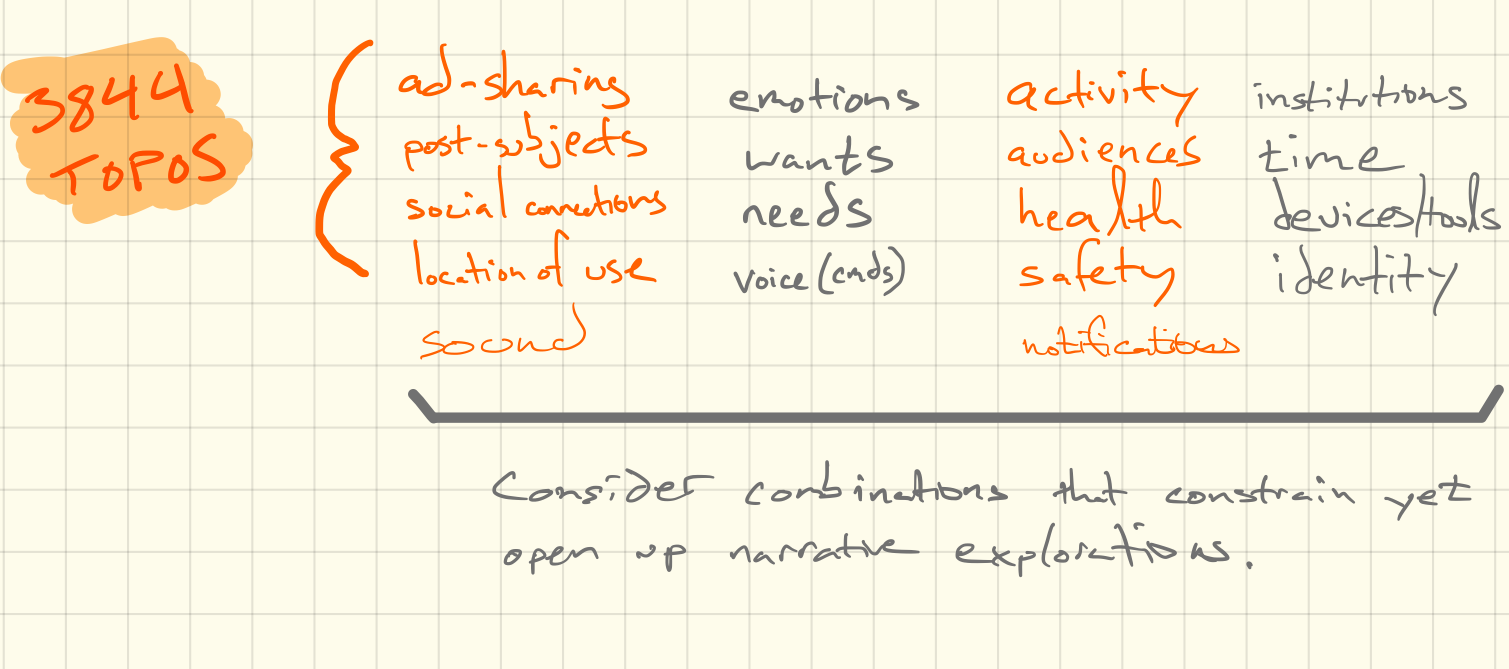
Consider & combine topos
Define the basic parameters of your study through an invention process that plays with topics of import.
-
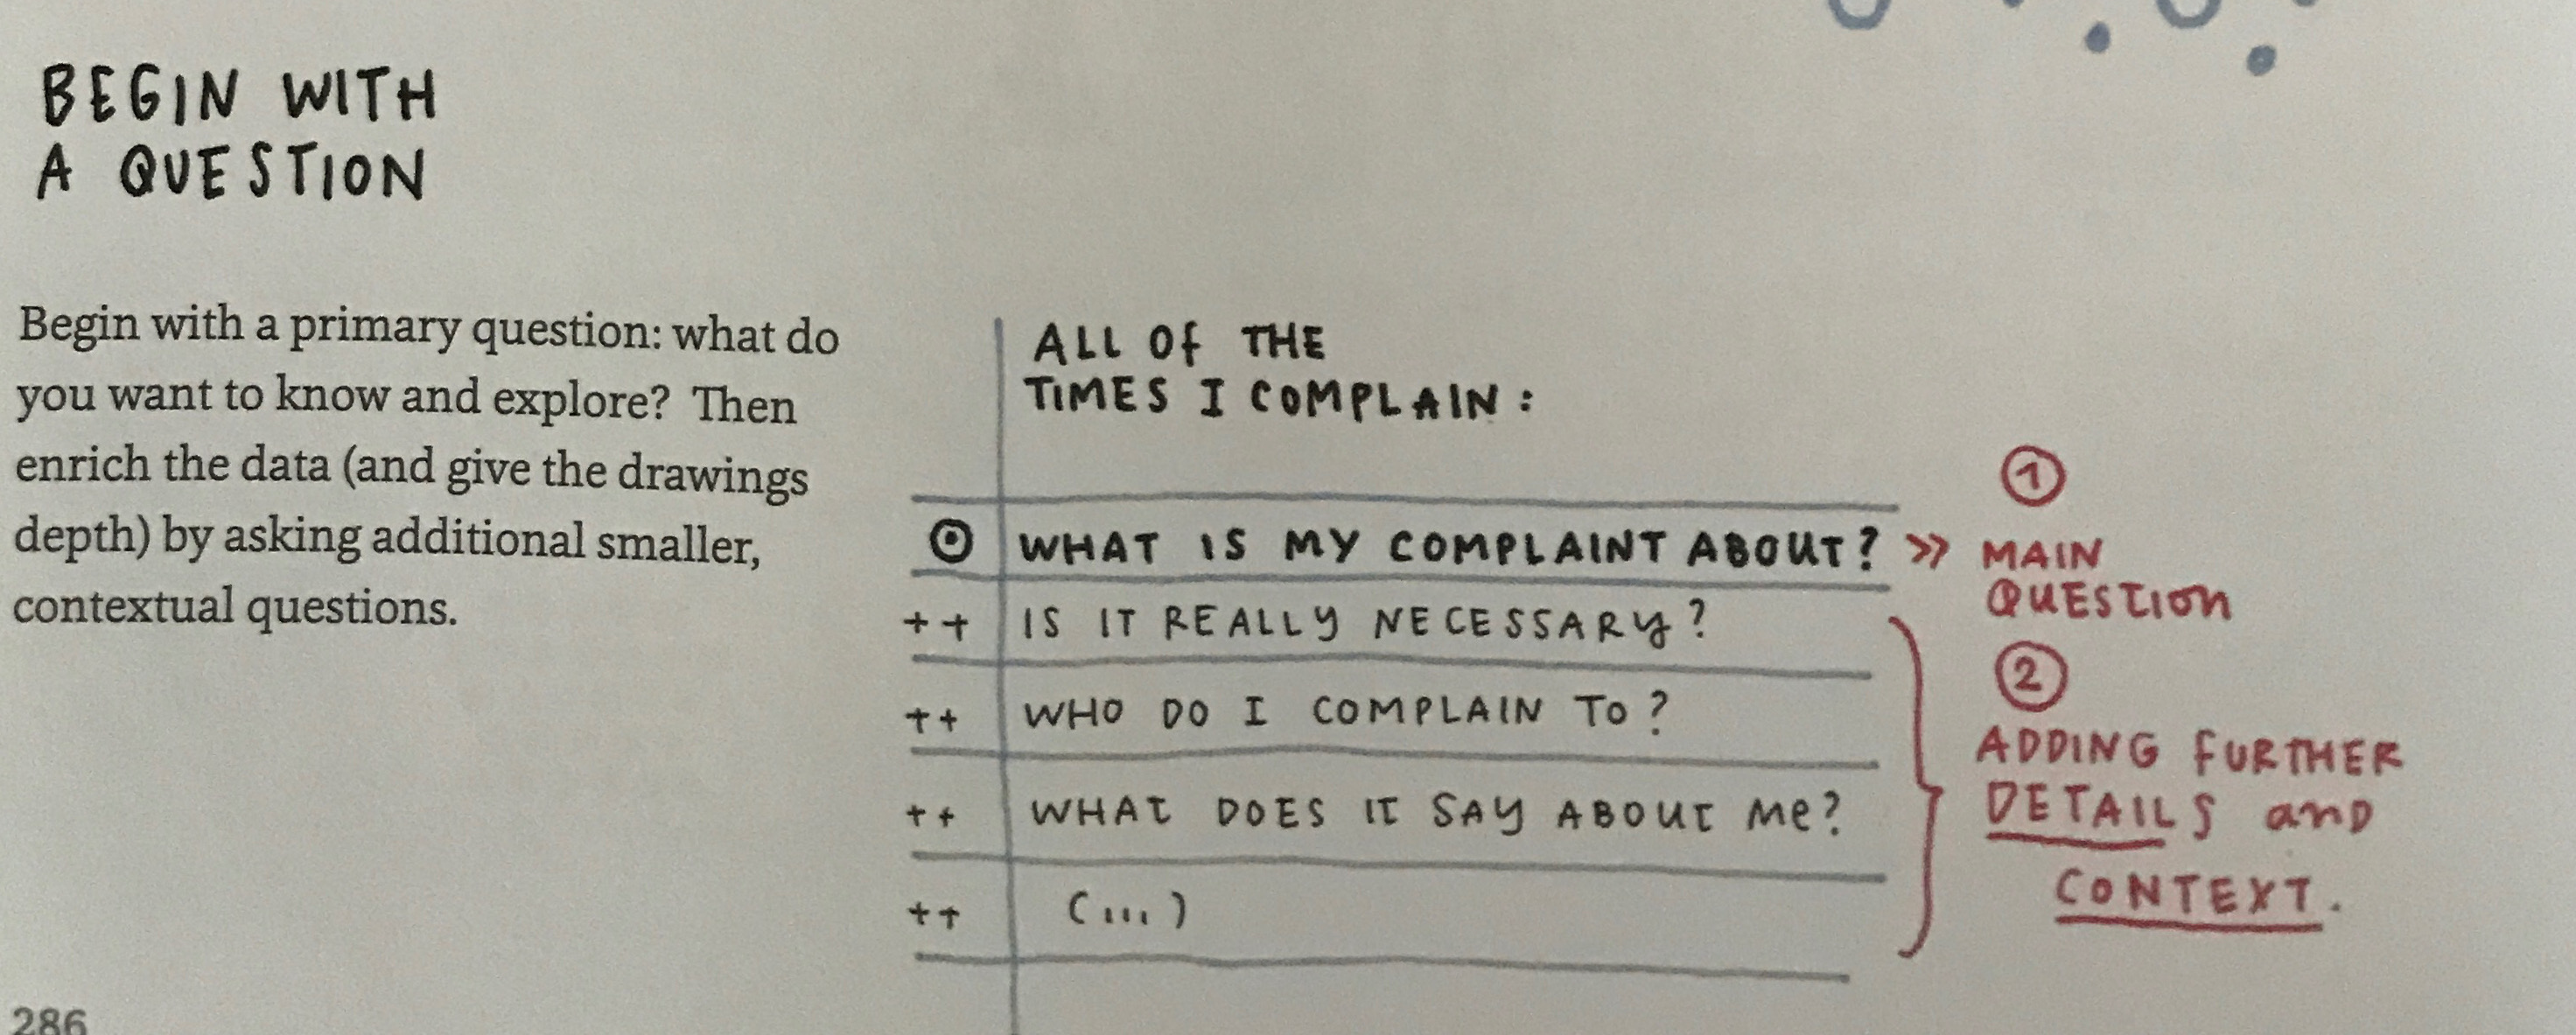
Distill your data-story topic as research question(s)
Refine the topical parameters of your study with a sharp set of questions.
-
Plan data-collection strategies
Learn how to create a balance of well-planned and creative set of techniques.
-
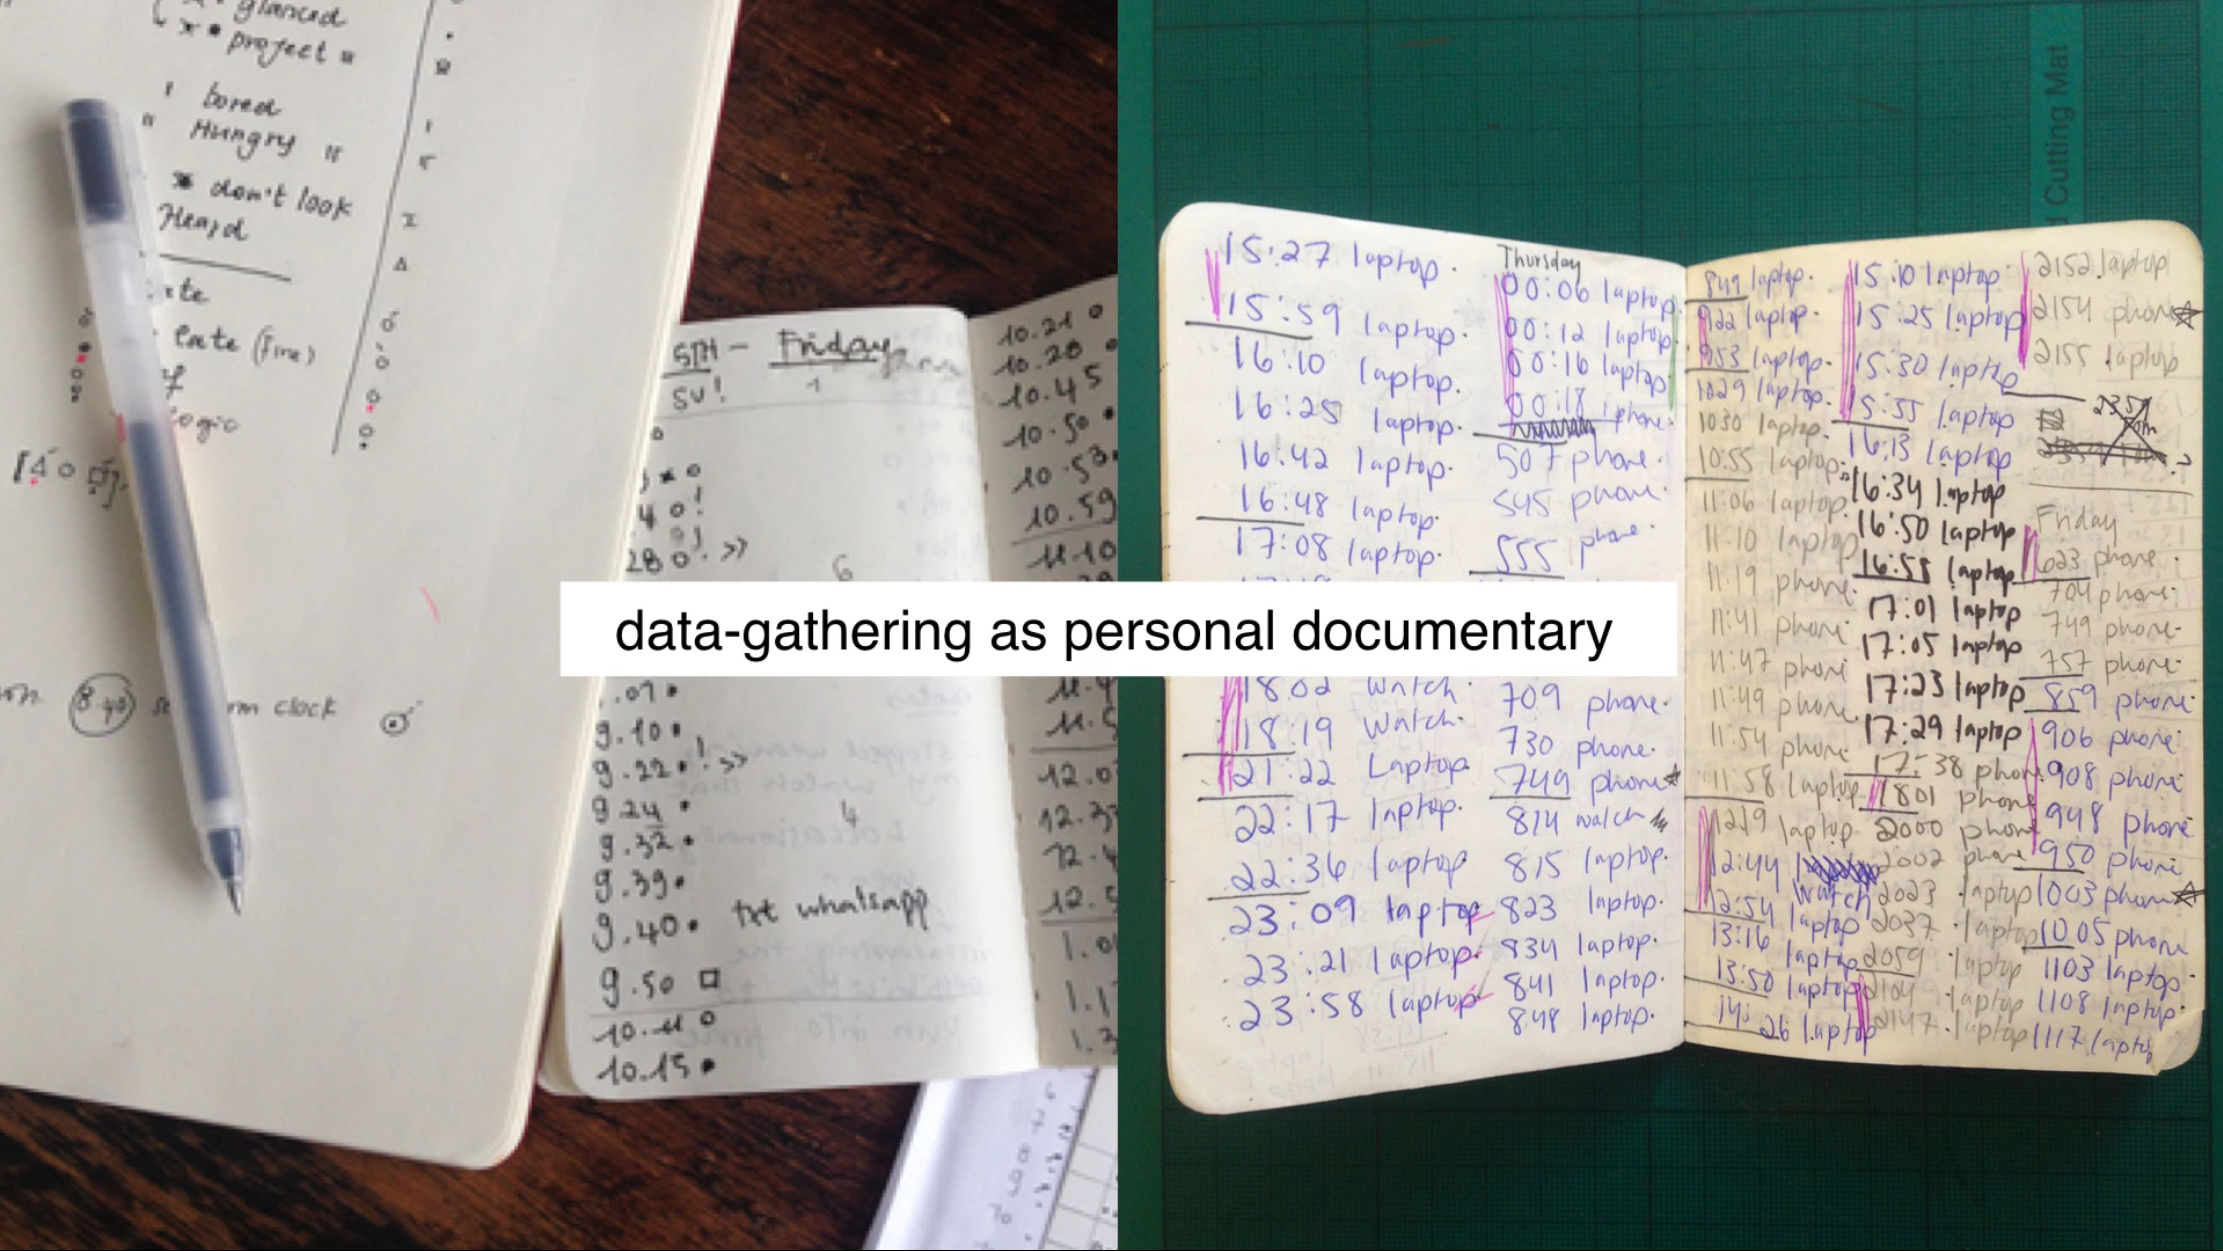
Collect your data
Gather the data with your well-planned set of techniques, leaving room for creative hacks along the way!
Your data set will serve as the inventive seed by which your narrative grows as you work through the next 4 sub-projects: 1) A data visualization created in SVG (Scalable Vector Graphics); 2) Wireframes to help you sketch out a plan for your data-story website; 3) Videos that draw out the contextual details and refined points of the narrative for your website; and 4) A single-page website that will tell the entire arch of your data story.
Rubric
The following rubric has been modified from Posavec’s explanation about her own rules by which she assesses her data-work:
- Data integrity: Includes logging truthful changes, modifications, and/or omissions with data collection
- Consistently log your data in a Google Sheets spreadsheet every evening
- Contextualize data in spreadsheet with details / notes
- Follows basic tidy data guidelines:
- Rows: Clear unit indexed per row: Every instance that I X
- Columns: Naming; Format and arrangement of columns
- Cells: 1 value, consistency of values, modify sheet according to redundancies, and limited amount of more complex cell data (1 preferable; 2 at the most)
- Sheets features: Meaningful uses of some spreadsheet features: conditional formatting, etc.