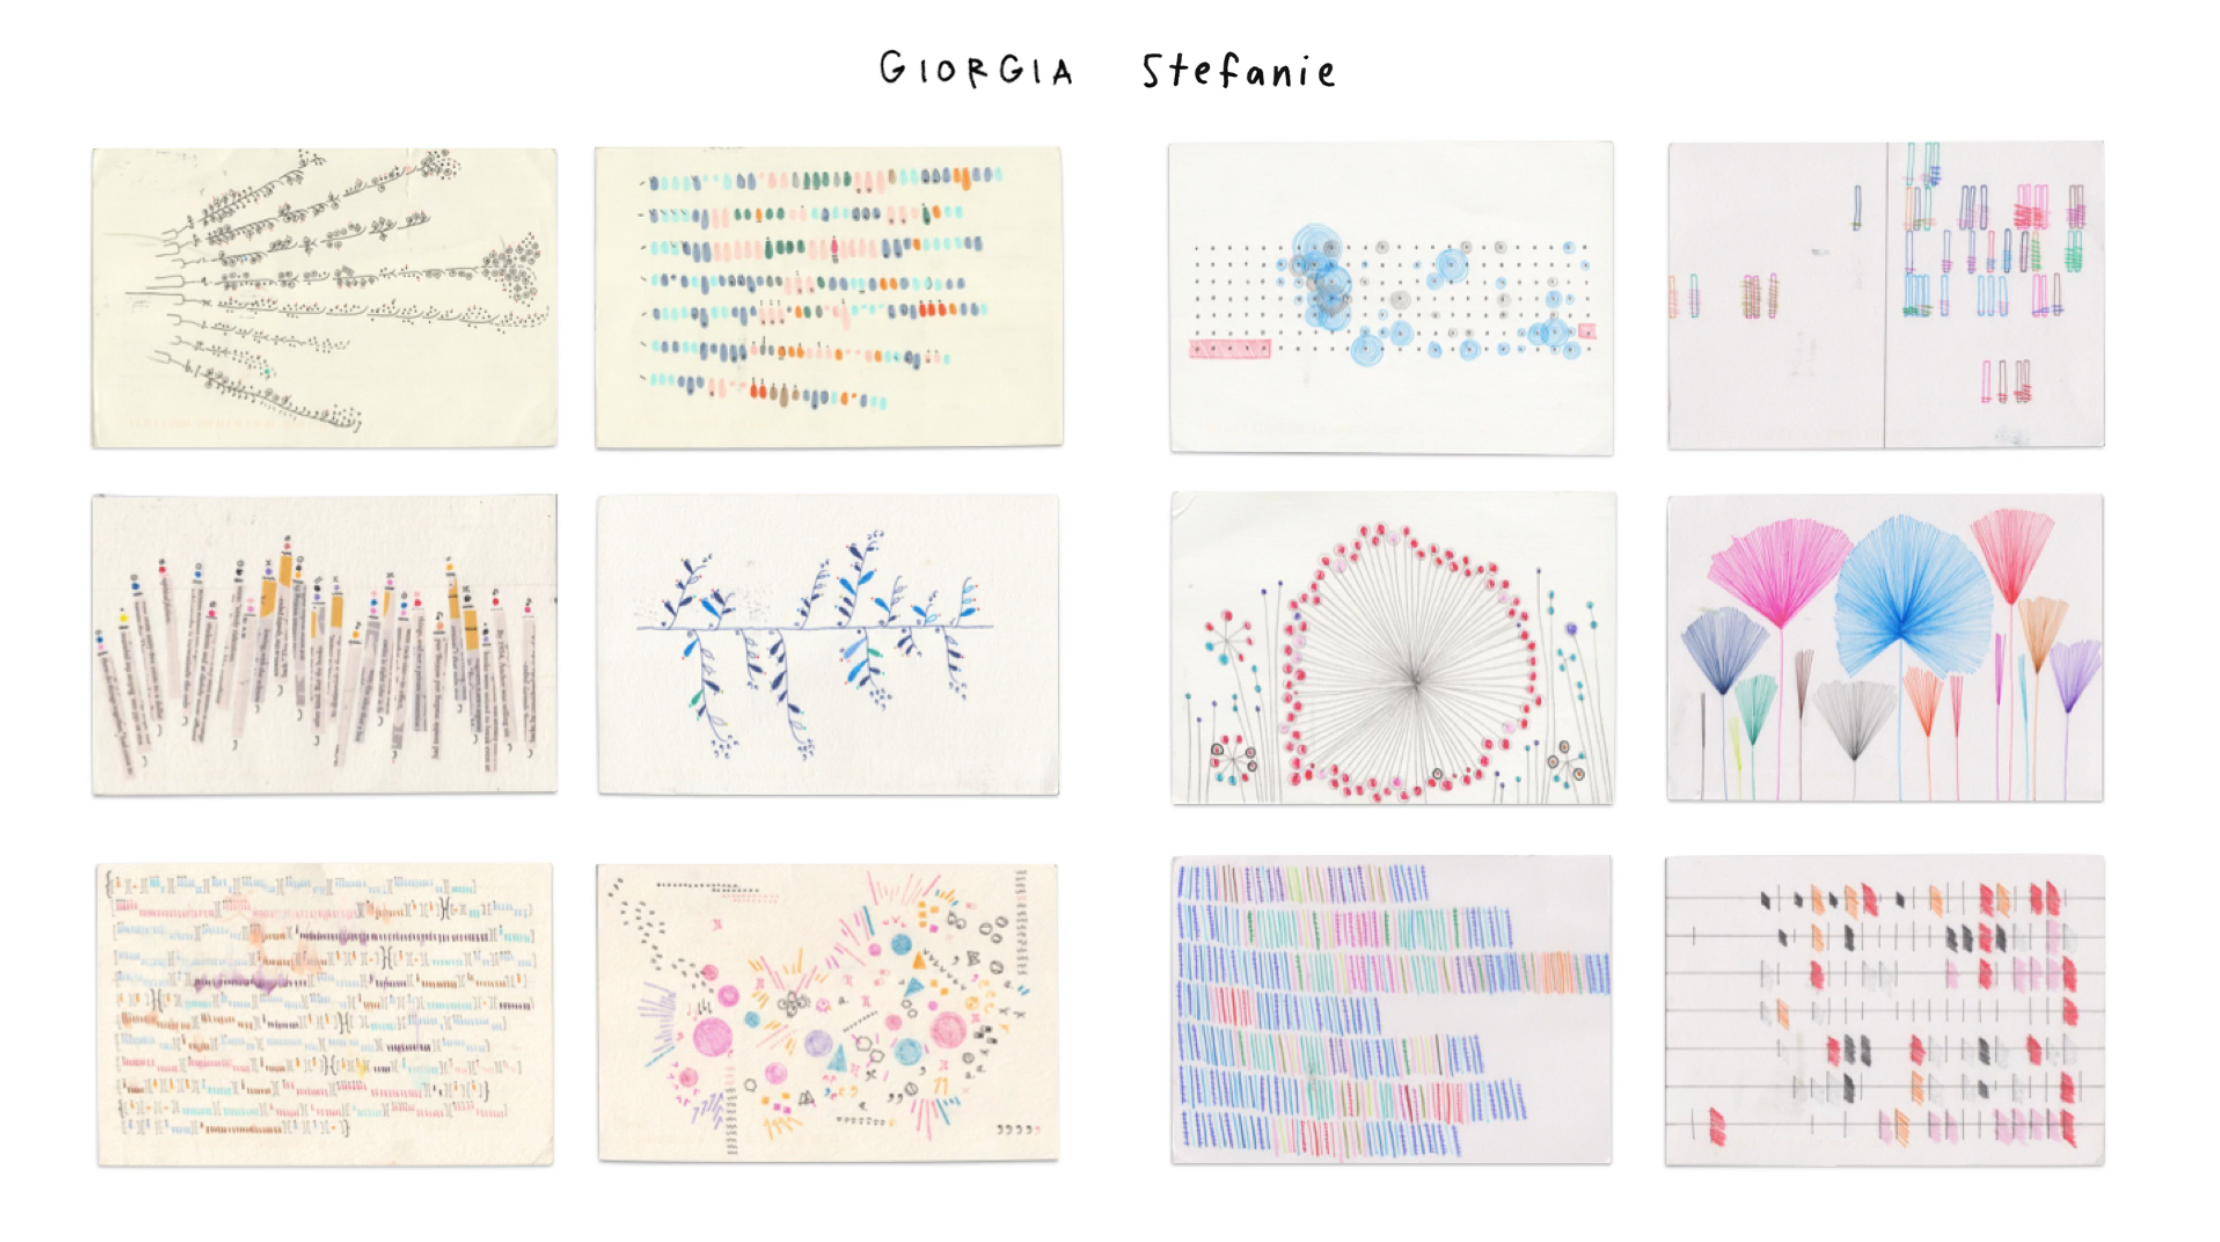
Data Collection for Your Data-Story
- Timeframe: 08/28/2017 – 09/25/2017
- Points: 100
| Data-Story Sub-Projects | Points (1000 total) |
|---|---|
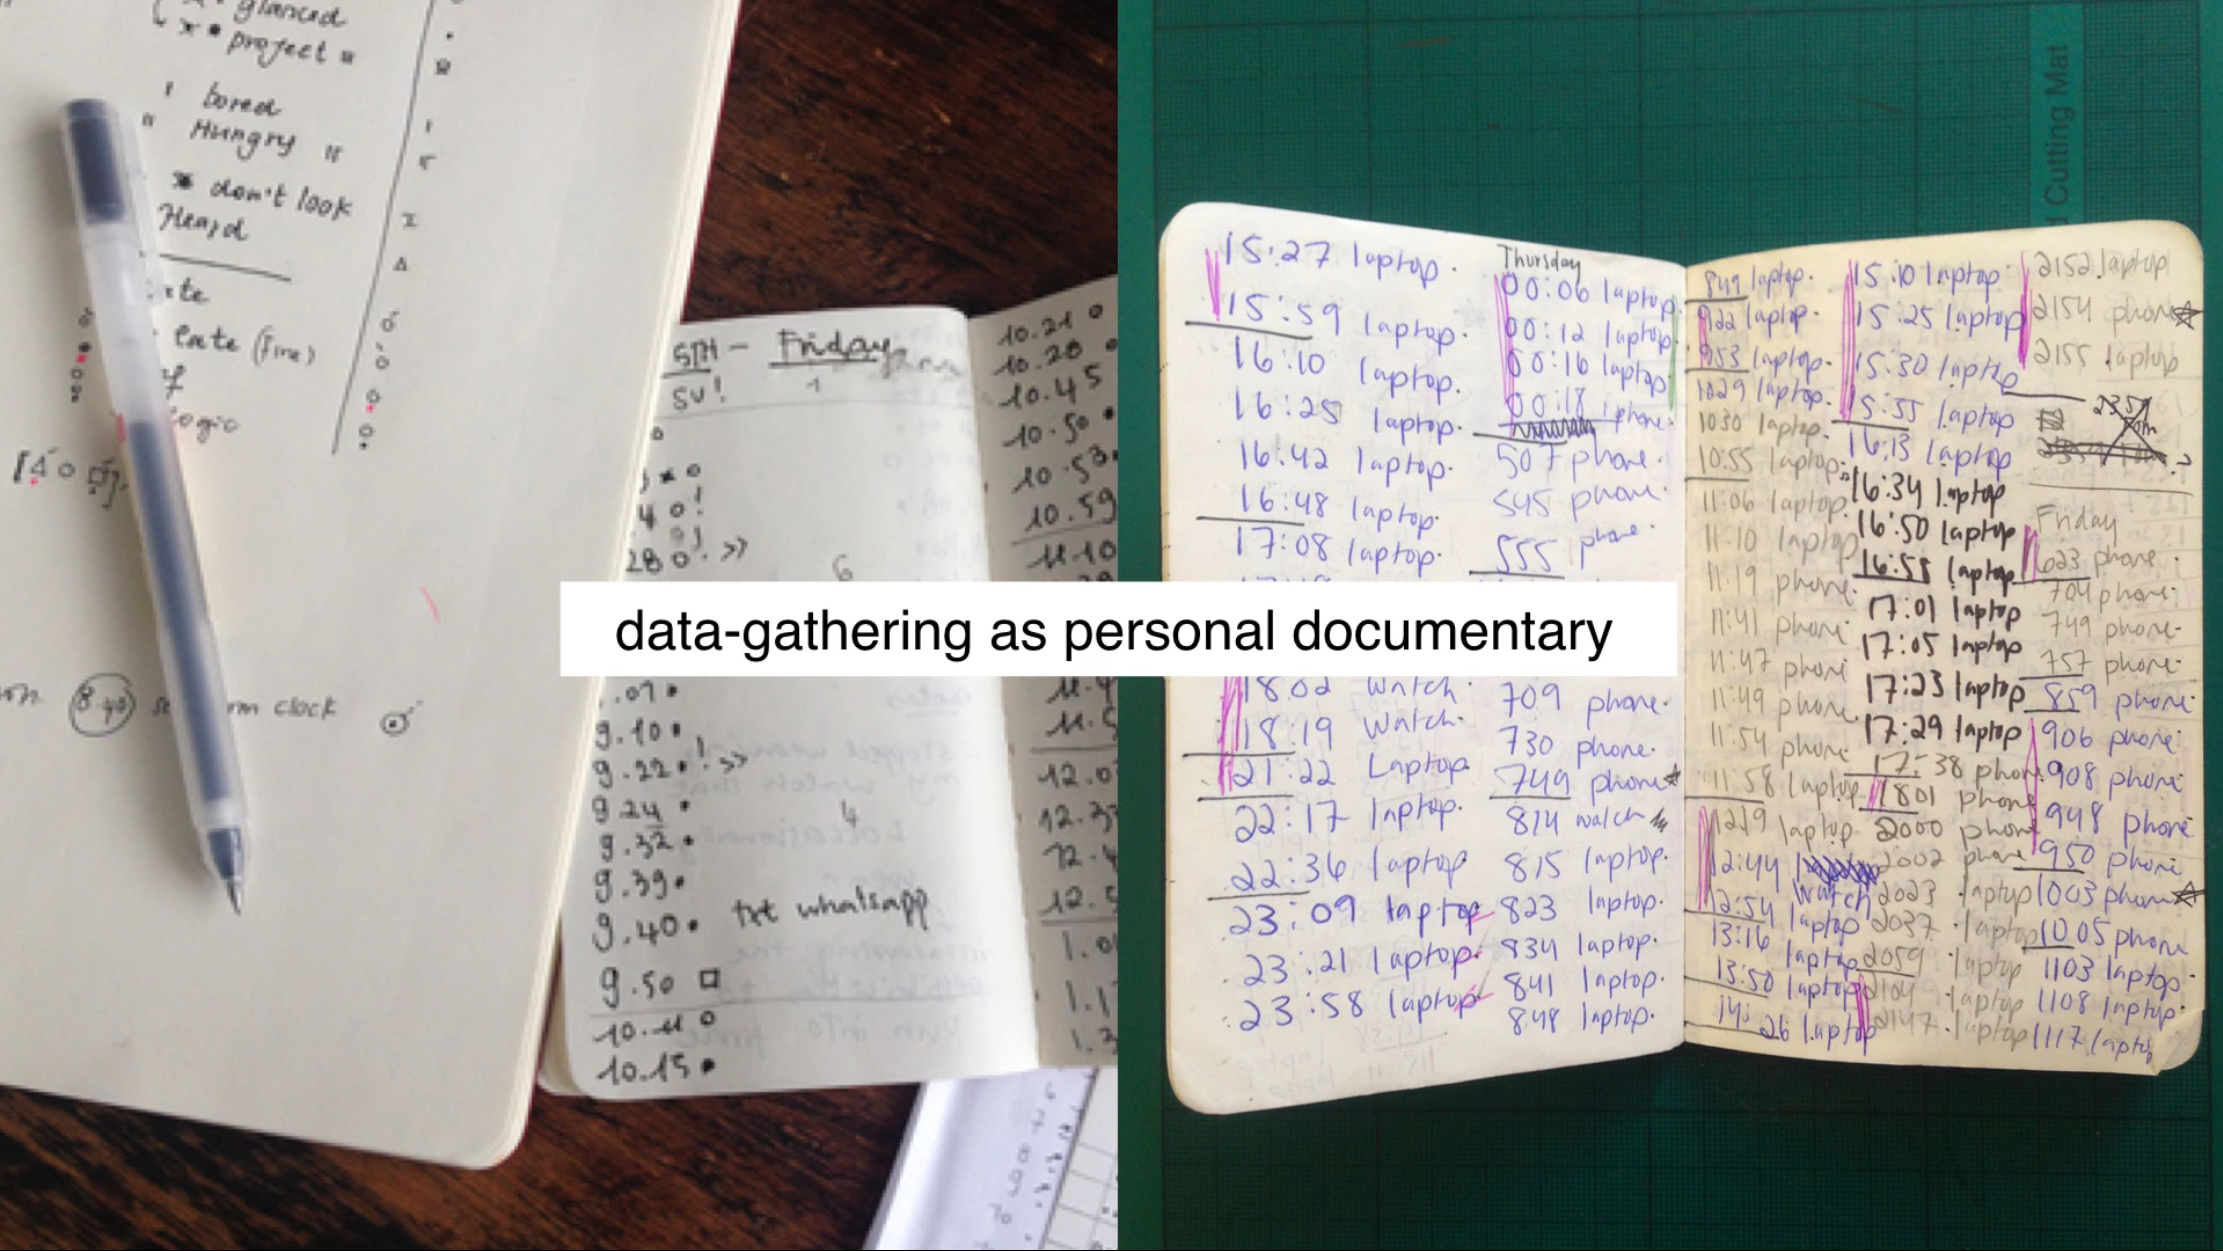
| Data Collection | 100 |
| SVG (Scalable Vector Graphics) Data Visualization | 250 |
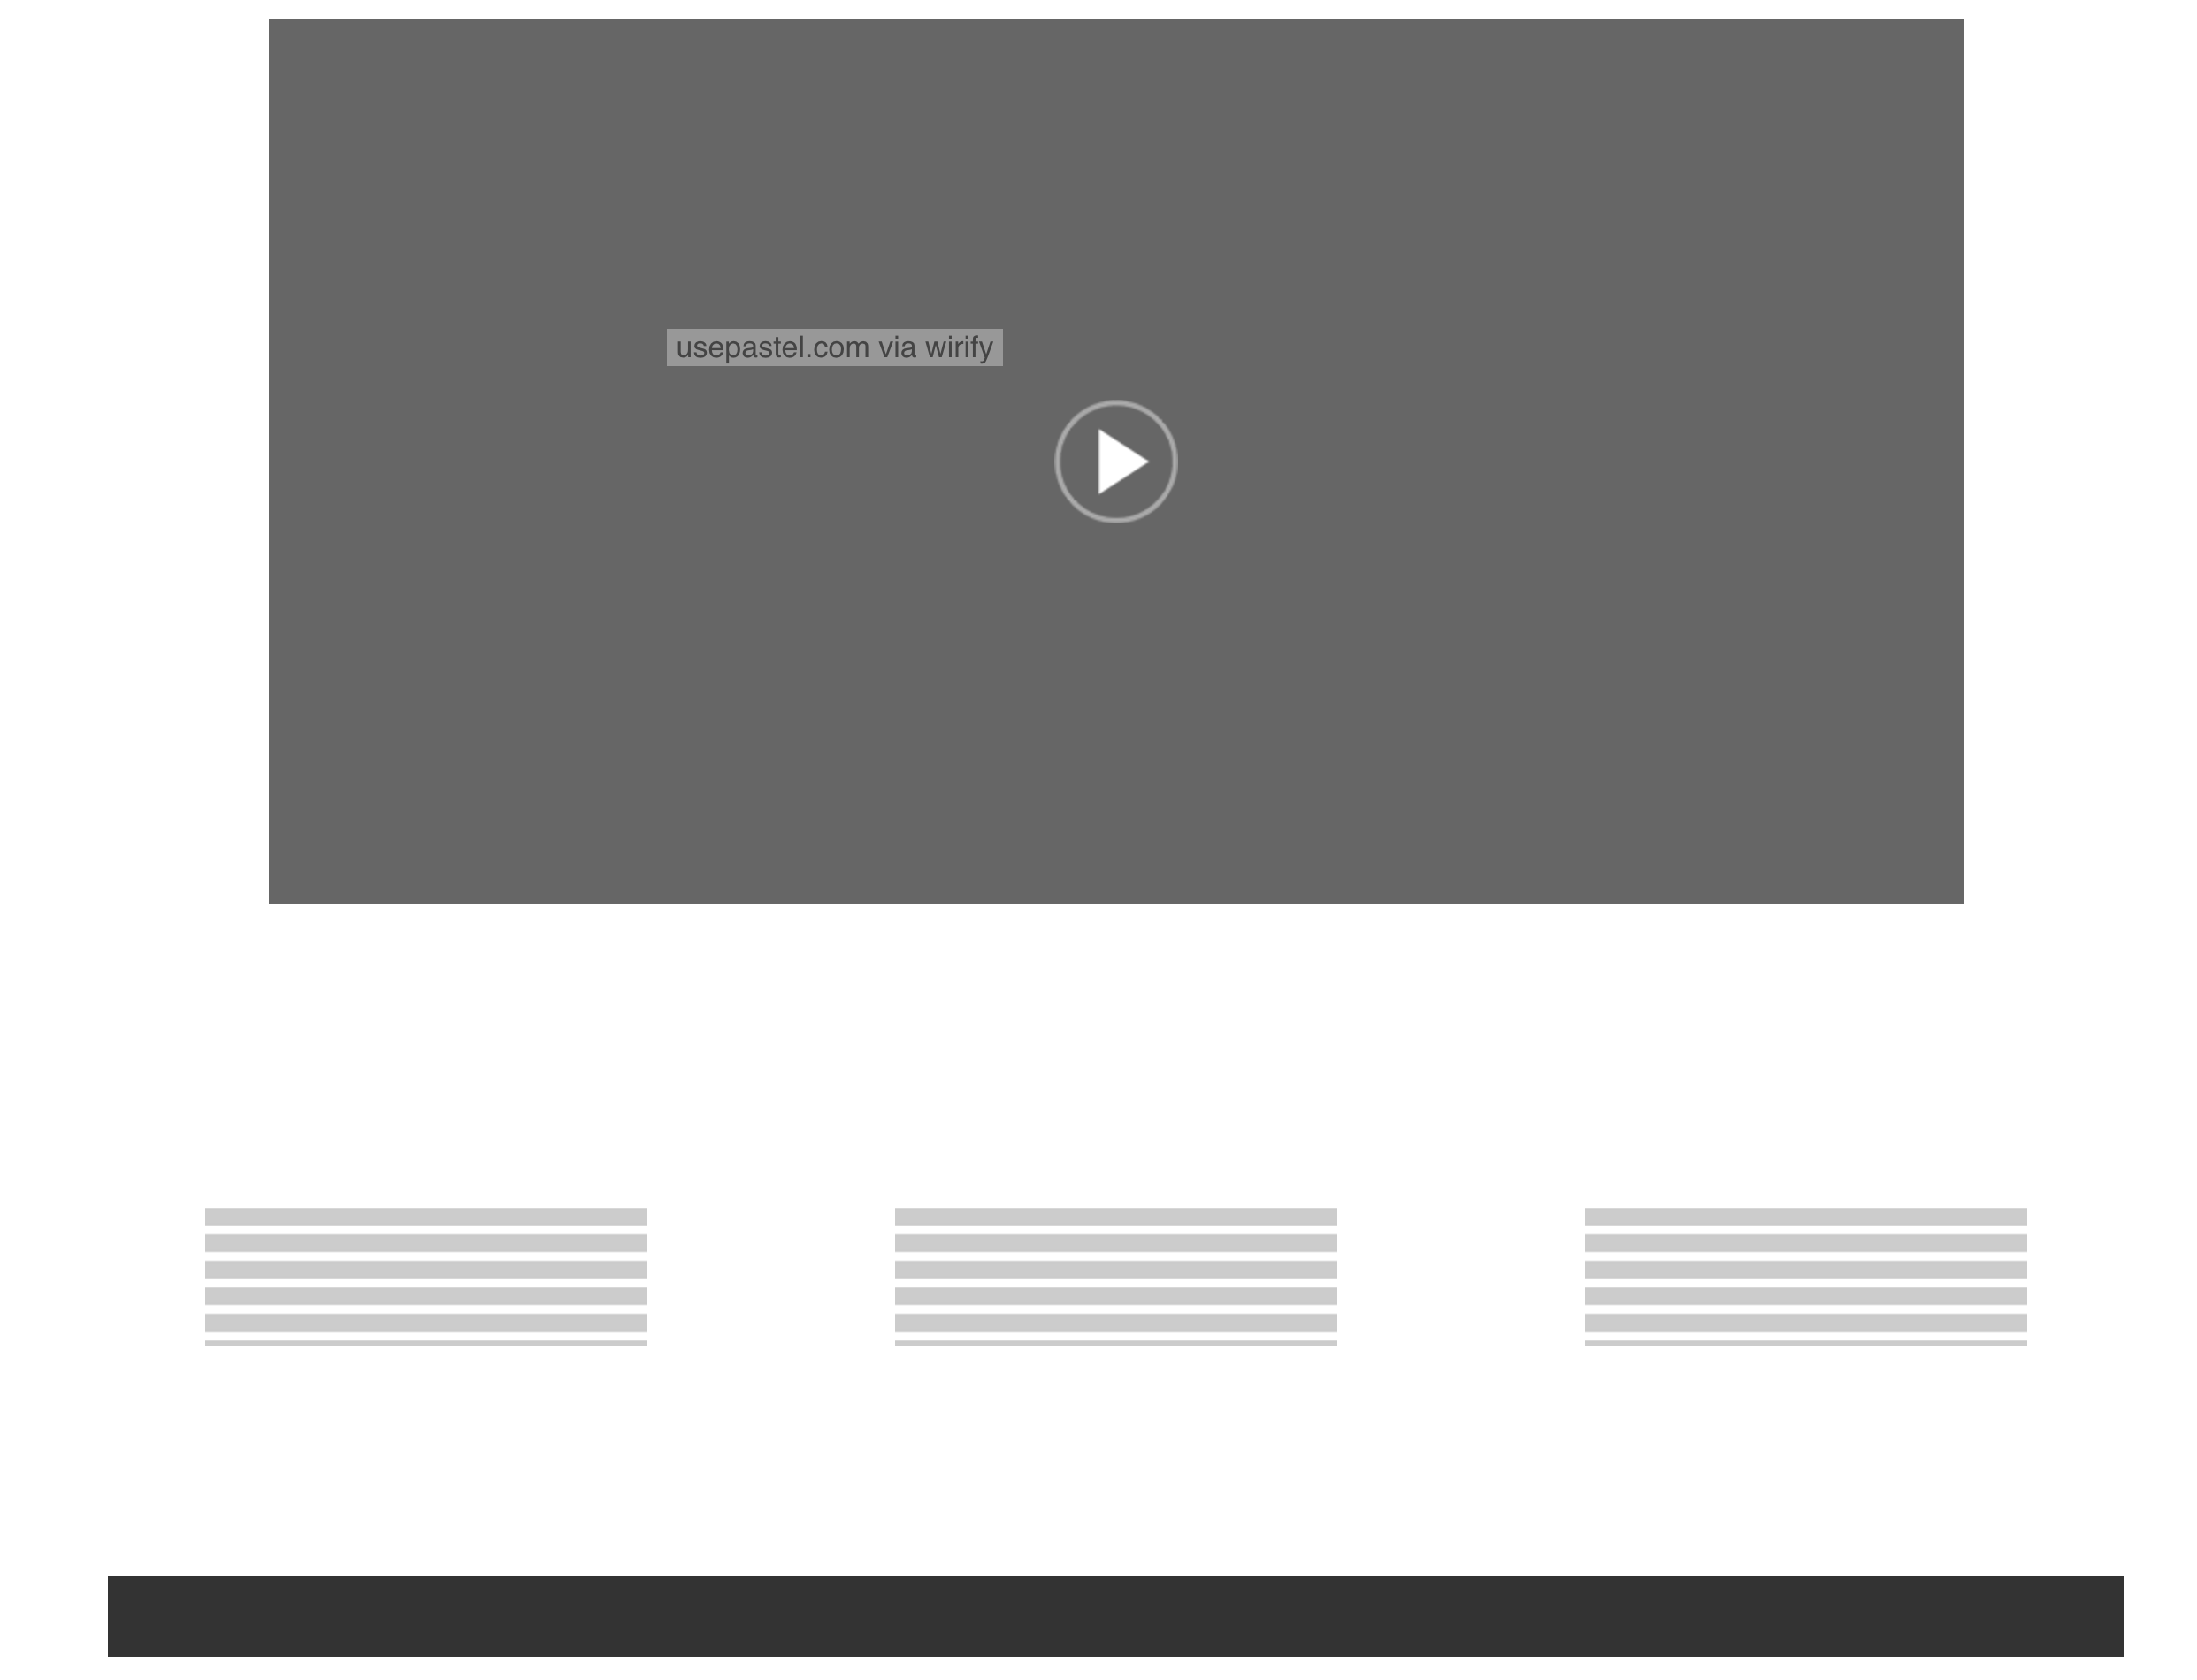
| Video Production | 200 |
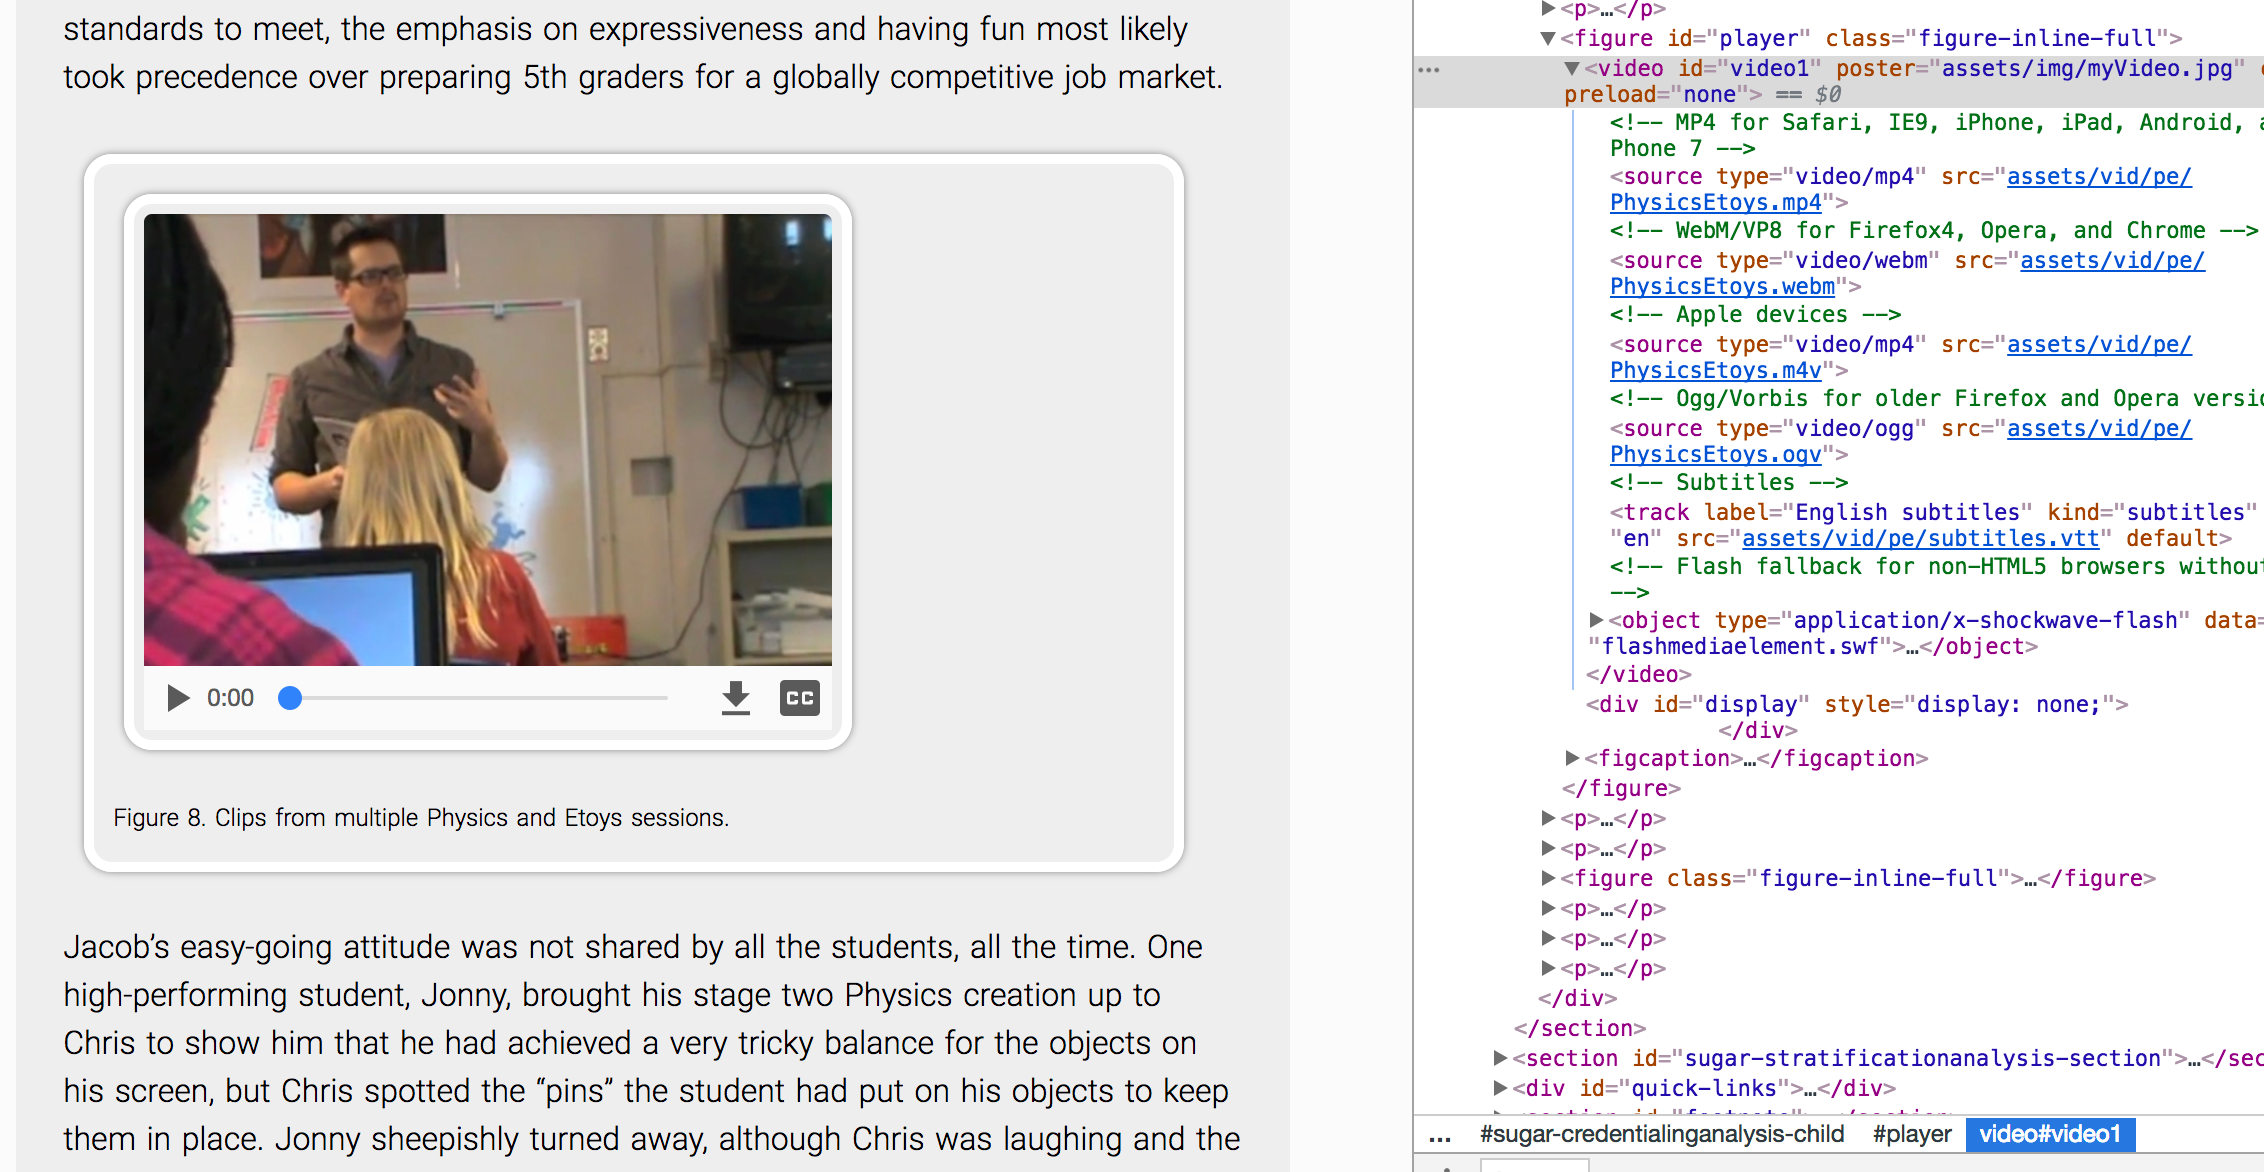
| HTML5 / CSS3: Developing Your Data Story as a Single-Page Website | 350 |
| Class Participation | 100 |
| Total | 1,000 |